
Earned media metrics are the numbers that show what coverage you did not pay for actually did: how much of it you won, who saw it, what it said, and whether anyone acted afterward. The best set mixes a few output counts (placements, reach, share of voice), a few outtake signals (referral traffic, sentiment, message pull-through) and at least one outcome tied to the business (leads, enquiries, sales). The metric to treat with the most caution is the dollar figure that claims to price your coverage.
This guide is for marketers, PR agencies, startups and nonprofits in Australia who need to report on press coverage without inflating it. It covers what to count, how to calculate the common measures, where the popular ones fail, and how to pick a short list of KPIs for a campaign.
TL;DR
- Earned media is coverage generated by outside parties such as journalists and customers, so you cannot guarantee it. Measure it by quality and effect, not volume alone.
- Track three layers: outputs (placements, reach, share of voice), outtakes (traffic, engagement, sentiment, message pull-through) and outcomes (leads, enquiries, conversions).
- Treat advertising value equivalents and earned media value with suspicion. They price media space, not the effect of your story.
- Pick three to six KPIs tied to a written objective, and report them against a baseline before and after the campaign.
- Publishing a press release creates a trackable asset: a URL, a distribution list and a date to measure from.
Table of Contents
- What counts as earned media
- The three layers: outputs, outtakes and outcomes
- Core coverage and reach metrics
- Quality metrics: tone, prominence and message delivery
- Why advertising value figures mislead
- Connecting coverage to traffic, leads and sales
- Which metrics to track if you are a business, agency, startup or nonprofit
- How to choose and report your KPIs
- Making your release measurable from day one
- Our perspective
- Publishing a release you can measure
- FAQ
- Sources
What counts as earned media
The Media Federation of Australia defines earned media as media activity about a company or brand that is generated by external sources, such as customers or journalists. You did not buy the placement and you do not control the wording.
That has two consequences for measurement. First, the same federation notes in its 2024 guide that earned media offers third-party credibility and long-term search benefit, but is unreliable and hard to scale because editorial exposure cannot be guaranteed. A good month and a bad month can look very different even when your effort was identical. Second, because you did not buy it, there is no invoice or delivery report to read the results from. You have to assemble the evidence yourself from monitoring tools, web analytics and, sometimes, direct questions to your audience.
The three layers: outputs, outtakes and outcomes
The cleanest way to organize earned media KPIs is the output, outtake and outcome split used across PR measurement. Australian agency Next Level PR groups its measures this way: outputs are placements, reach, share of voice and mention frequency. Outtakes are earned-media website traffic, engagement, search lift, message pull-through and sentiment. Outcomes are leads, conversions, assisted conversions, enquiries and pipeline contribution.
The Public Relations Institute of Australia's Measurement and Evaluation Framework, published in 2017, takes the same view. It asks you to set SMART communication objectives that support the organization's objectives, then evaluate progressively during and at the end of a campaign against outputs, outcomes and impact.
| Layer | What it answers | Example metrics |
|---|---|---|
| Outputs | What did we get? | Number of placements, estimated reach, share of voice, mention frequency |
| Outtakes | What did people do or think? | Referral traffic, engagement, sentiment, message pull-through, branded search |
| Outcomes | What changed for the business? | Leads, enquiries, assisted conversions, donations, sign-ups, pipeline |
Outputs are easy to collect and easy to overstate. Outcomes are the ones a finance director or board cares about, and they are the hardest to attribute. A sound report shows all three in a chain, so the reader can follow how a placement led to a visit and a visit led to an enquiry.
Core coverage and reach metrics
Placements and mentions
Start with a plain count: how many outlets ran or referenced your story, and how many times your brand was named. Adoni Media's guide lists media mentions, sentiment analysis and coverage value as core monitoring measures. A count on its own tells you very little, so always split it: by outlet type (trade, regional, national, online-only), by whether the link points to your site, and by whether your name appears in the headline or only in the body.
Reach
Reach estimates how many people could have seen the coverage. A widely used proxy is unique visitors per month for the outlet. Hawthorne Strategy notes that this figure does not tell you the exact readership of a specific page or story. A site with a million monthly visitors may have shown your article to a few hundred of them.
That limit applies to any audience figure. If you want a clear view of why audience numbers need context, this checklist on audience figures is a useful companion for estimating potential reach and its caveats. Report reach as a range or as "potential reach", never as people persuaded.
Impressions
An earned impression is a count of how many times content was displayed to an audience through organic, unpaid distribution, for example when people re-share or engage with a post, as one explainer on earned impressions puts it. An impression is not a click. As Brafton Australia explains, a served impression counts when a page loads the content, while a viewable impression requires at least half of it to appear in the visible part of the page, and definitions vary by channel. Always state which definition you are using, or two reports will not be comparable.
Share of voice
Share of voice compares your mentions with those of competitors across a chosen set of outlets and a chosen period. Finn Partners lists share of voice among the quantitative PR measures, alongside website traffic and social engagement. It is only as good as the competitor set and outlet list you define, so fix both at the start and keep them stable.
For comparing coverage volume and social engagement over time in a consistent way, digital campaign indicators are the kind of quantitative signals that belong in the same dashboard.
Quality metrics: tone, prominence and message delivery
Ten mentions in places your customers never read are worth less than two in the right place. The AMEC Barcelona Declaration of Measurement Principles says that measurement should account for quality, including tone, credibility of the medium, relevance, message delivery and prominence.
In practice, score each piece of coverage on a few simple scales:
- Sentiment. Positive, neutral or negative. Adoni Media describes sentiment analysis as categorizing mentions in exactly those three bands.
- Prominence. The share of a story devoted to you. Hawthorne Strategy defines it as a percentage, with more than 71% counted as very prominent and under 30% as not prominent.
- Message pull-through. Did the article repeat your key message, your product name or your spokesperson's quote? Tick each one off against the points you set out in the release.
- Audience relevance. Streem recommends judging earned coverage on quality, audience relevance, interaction, key-message tracking and website traffic rather than on volume alone.
A short scoring sheet with a 1 to 3 scale for each criterion is enough. The point is to be consistent, so that a 2 means the same thing in March and in September.
Why advertising value figures mislead
The metric most search results push is earned media value, or EMV. Shopify Australia gives the formula as impressions multiplied by CPM (cost per thousand impressions), and cautions that the result suits comparing earned campaigns better than benchmarking against paid or owned media. The arithmetic is simple, which is why it spreads.
The trouble is what it measures. AMEC states that advertising value equivalents measure the cost of media space, not the value of public relations, and it rejects them as a way to value PR. The same document says multipliers meant to reflect a higher cost for earned versus paid media should never be applied unless they are proven to exist in the specific case.
There are practical reasons to agree:
- A negative story gets a dollar value just like a glowing one.
- A passing mention in a long article is priced like a feature.
- The CPM you pick is a guess, and changing it changes the result without any change in performance.
- The number flatters you in a report and then cannot survive a question from the finance team.
If you need a single number for internal comparison, use EMV only to rank your own campaigns against each other, label it as an estimate, and put it beside outcome data. For a deeper look at why unverified media-value multipliers are poor measures, this marketing channel ROI prompt shows one way to structure a channel comparison without leaning on them.
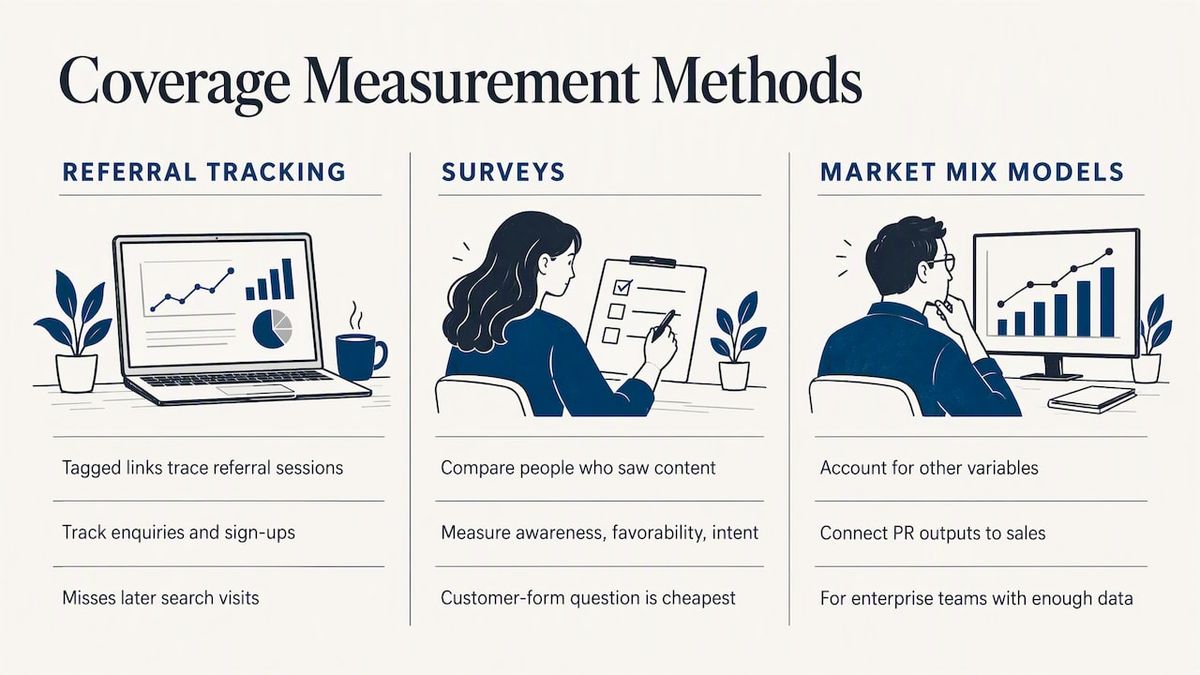
Connecting coverage to traffic, leads and sales
This is where most earned media reporting stops short. Three methods work at different levels of effort.
1. Referral traffic and conversions. VSSL Agency notes that Google Analytics referral reports let you attribute traffic and conversions to earned media links. Tag the link in your release, check which referring domains appear, and follow those sessions to a goal such as an enquiry form or a sign-up. This will miss people who read a story and search for you later, so also watch branded search and direct traffic in the weeks after publication.
2. Surveys and brand lift. Brand lift studies compare awareness, favorability and purchase intent between people who saw the content and people who did not, which VSSL calls a useful way to assess earned media. AMEC adds that surveys can isolate changes in purchasing, preference or attitudes caused by PR. A short question added to a customer form ("How did you hear about us?") is the cheapest version.
3. Market mix models. For larger budgets, AMEC says to use market mix models to measure the effect of PR outputs on sales or other business metrics while accounting for other variables. This is realistic for enterprise teams with enough data, and overkill for most startups.
Whichever you use, record a baseline first. Without the traffic, enquiry and search numbers from the four weeks before the campaign, any "lift" is a story you tell yourself.
Which metrics to track if you are a business, agency, startup or nonprofit
No single source we reviewed gives a definitive list per organization type, so treat this as our working view built on the framework above. Finn Partners makes the underlying point that there is no single silver bullet: the approach has to fit the business objective and combine quantitative and qualitative methods.
| Organization | Primary objective | Suggested KPIs |
|---|---|---|
| Established business | Reputation and demand | Share of voice, sentiment, message pull-through, referral traffic, enquiries |
| PR agency | Prove value across clients | Placements by tier, prominence score, client-specific outcomes, consistent monthly template |
| Startup | Awareness and credibility | Number of quality placements, branded search lift, referral traffic, sign-ups, backlinks |
| Nonprofit | Support and action | Coverage in audience-relevant outlets, sentiment, donations or volunteer sign-ups, enquiry volume |
Agencies should keep the same metric definitions across clients, so a report in one account reads like a report in the next. Startups should resist chasing big-name outlets alone: three relevant trade placements that send qualified visitors often beat one broad mention. Nonprofits usually find that audience relevance and an action (a donation, a registration) say more than raw reach.
How to choose and report your KPIs
- Write the objective first. Make it specific, measurable and tied to a business goal, in line with the SMART approach in the PRIA framework linked above. "Raise awareness" is not an objective. "Reach 200 qualified visits from trade coverage in eight weeks" is.
- Pick three to six KPIs across the layers. At least one output, one outtake, one outcome.
- Set the baseline. Capture current traffic, branded search, mention counts and share of voice before the story goes out.
- Define each measure in writing. Which impression definition, which outlets count, which competitor set, which sentiment rules.
- Measure progressively. Check at one week, one month and the end of the campaign, as the PRIA framework suggests, rather than once at the end.
- Prefer outcomes to clip counts. The Barcelona Declaration prefers measuring outcomes, such as shifts in reputation and purchase preference, over outputs like the number of clippings.
- Report honestly. Include the coverage that missed, the negative mentions and the limits of attribution. A report that admits uncertainty is believed more.
Making your release measurable from day one
Measurement is easier when the story is built for it. Before you publish, decide the one action you want a reader to take and put a tagged link to it in the release. Add a clear headline with the subject of the story in it, a quote from a named spokesperson (so you can track pull-through), and media such as images, so that outlets have something to reuse.
A published release on a news platform also gives you a fixed URL and date, which makes before-and-after comparisons simpler. You can see what a finished release looks like in examples such as this business milestone announcement or this product launch release.
Our perspective
We see press releases from startups, agencies, nonprofits and established brands every week, and the pattern is consistent: the ones that get measured well were planned with the measurement in mind. They have one clear news hook, one link to track and one outcome the sender cares about.
We also think the industry leans too hard on a dollar figure. A release is not an advertisement, and pricing it as one invites arguments you cannot win. We would rather you report five honest numbers, including a modest one, than one impressive estimate that collapses under questions.
Our own position follows from that. We focus on getting a release reviewed, published quickly and distributed with search visibility in mind, because a findable, credible page is the thing every later metric depends on. Our editorial review runs on the editorial standards we publish, and we do not promise coverage, because no honest service can. What we can promise is a clean, well-formed starting asset to measure from.
— Matthew
Publishing a release you can measure
If you are ready to put a story out and track its effect, our Single Release option costs $39 one-off. You submit the release, it goes through editorial review, and it is published and distributed to journalists and media outlets. Agencies and larger teams can ask about custom and enterprise packages on the same pricing page. When your release is drafted, you can submit it here.
FAQ
What is an earned media impression?
It is a count of how many times content was shown to people through unpaid, organic distribution, such as a share or a re-post of your story. It is not a click and not proof that anyone read the piece. Always note whether you counted served or viewable impressions, since definitions vary by channel.
How do you calculate earned media value?
The common formula is impressions multiplied by CPM, divided by one thousand when the CPM is quoted per thousand. For example, Shopify Australia illustrates the method with a $10 CPM. Treat the result as a rough comparison between your own campaigns, because AMEC rejects advertising value equivalents as a measure of PR value.
Which earned media KPIs should a small team start with?
Start with three: the number of relevant placements, referral traffic from those placements, and one outcome such as enquiries or sign-ups. Add a simple sentiment and message pull-through score once the basics are in place. Keep the list short enough that you will actually update it every month.
How long should you wait before measuring a press release?
Check early for the first spike in traffic and mentions, then again after a few weeks for search and enquiry effects. The PRIA framework recommends evaluating progressively during and at the conclusion of a campaign. Late coverage and search visibility can keep building, so keep the tagged link in your reports.
Sources
- Earned Media, MFA Digital Foundations Glossary
- The MFA Guide, Section 2, Media: The Process (2024)
- Barcelona Declaration of Measurement Principles, AMEC
- Measurement and Evaluation Framework, PRIA
- How To Calculate Earned Media Value, Shopify Australia
- Key Metrics for Evaluating PR Success and ROI, Next Level PR
- How to measure the success of a PR campaign, Adoni Media
- How do you measure PR?, Finn Partners (2024)
- How To Measure Your Communications' Impact, Hawthorne Strategy
- How Communicators Can Demonstrate Impact, Streem
- 10 Earned Media KPIs To Track for Marketing Success, VSSL Agency
- What are earned impressions?, Summer
- Impressions marketing and brand awareness, Brafton Australia