
Press release analytics is the practice of recording what happened after you published a release (views, pickups, visits, enquiries) and tying those numbers to a business goal you set beforehand. The useful version is simple: pick two or three measures that match your objective, tag your links before you publish, and report the results against the goal, not as a pile of impressions.
This guide covers what to measure, how metrics differ from KPIs, how to trace website visits and leads back to a single release, why advertising value is a number to avoid, and how to report to a boss, a board or a client.
TL;DR
- Metrics record what happened (pickups, impressions, visits). KPIs link those numbers to an outcome you chose in advance, such as qualified leads or awareness.
- Set the objective before you publish, then choose a handful of measures that prove it. Three well-chosen numbers beat fifteen.
- Tag every link in the release with UTM parameters so Google Analytics can show the sessions, form fills and sales that came from it.
- Do not report advertising value equivalents. The industry's measurement body rejects them as a measure of value.
- Report coverage quality, business impact and learnings each time, and keep a baseline so you can show change.
Table of Contents
- Metrics versus KPIs: the difference that shapes your report
- Start with the goal, not the dashboard
- The press release metrics worth tracking
- Tracing visits and leads back to one release
- Why you should skip advertising value
- Calculating ROI without fooling yourself
- Using an Australian framework for planning
- How to report results
- Common mistakes that corrupt the data
- Publish with measurement built in
- FAQ
- Sources
Metrics versus KPIs: the difference that shapes your report
People use "press release metrics" and "press release KPIs" as if they were the same thing. They are not, and mixing them up is the most common reason a PR report feels empty.
A metric records an event. Onclusive's guide puts it this way: metrics capture what happened, such as mentions, impressions and visits, while KPIs connect those activities to strategic outcomes such as growth in awareness or qualified leads.
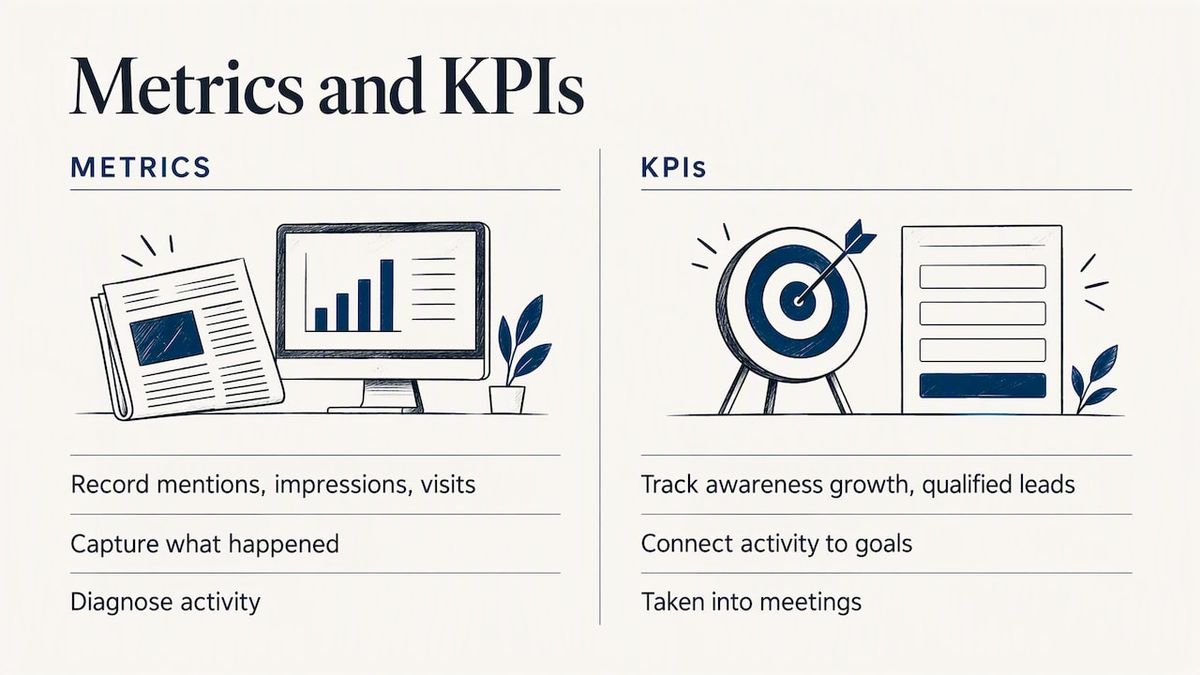
So "the release was picked up 14 times" is a metric. "Pickups in trade media our buyers read lifted demo requests by a set amount against last quarter" is a KPI result. The first is easy to collect. The second needs a goal, a baseline and a way to connect the two.
In practice, you will track many metrics and a few KPIs. The metrics are your diagnostics. The KPIs are what you take into a meeting.
Start with the goal, not the dashboard
Analytics that begin with "what can we count?" end up counting whatever is easy. Australian and international guidance both begin elsewhere.
The AMEC Barcelona Principles, the global reference for communication measurement, say measurement should begin with clear, measurable objectives, cover the relevant channels, combine qualitative and quantitative analysis, and report outputs, outcomes and the impact on the organisation or its stakeholders. An earlier edition adds that goals should be SMART, naming who you want to reach, what should change, by how much and by when.
A workable goal for a release looks like this:
- Weak: "Get the word out about our new service."
- Better: "Get 500 visits from tradies and builders to the new service page and 20 quote requests within 60 days of publishing."
The second version tells you what to tag, what to watch and when to stop and review.
Match the goal to the audience
Different organisations need different proof from the same release.
- Businesses announcing news: enquiries, quote requests, sales on the featured product page.
- PR agencies: a repeatable report per client, with the same measures each time so results compare month to month.
- Startups: first-time visibility, referral traffic, sign-ups and the backlinks that help a young site show up in search.
- Nonprofits: donations, volunteer sign-ups, event registrations and reach among the specific community the story is for.
The press release metrics worth tracking
Finn Partners' measurement paper lists coverage volume, share of voice, media meetings, earned-media website traffic, email registrations and social engagement as quantitative measures, with awareness and attitude change as qualitative ones. That is a good menu. Here is how to turn it into a short list you can actually maintain.
| Measure | What it tells you | Where the data comes from |
|---|---|---|
| Pickups and placements | Who republished or covered the story | Your distribution page, search alerts, media monitoring |
| Reach and impressions | Potential audience size (an estimate, not proof of reading) | Publisher figures, platform reports |
| Referral sessions | People who clicked through to your site | Google Analytics with UTM tags |
| Engagement on site | Time on page, scroll, clicks on key buttons | Google Analytics |
| Conversions | Form fills, downloads, purchases, sign-ups | Google Analytics events, CRM |
| Backlinks | Links from other sites that may support search visibility | Search Console, backlink checkers |
| Share of voice | Your mentions relative to others in the same topic | Media monitoring |
| Sentiment and message pickup | Whether coverage carries your key message | Manual reading of a sample |
A tight set for most releases: pickups, referral sessions, conversions and message pickup. Add backlinks if search visibility is part of the goal.
Reach and impressions: treat them as estimates
Reach and impressions are the numbers everyone reports and the ones that prove least. They estimate how many people could have seen the story, not how many did. They are still useful for comparing one release with the next, provided you calculate them the same way each time.
Short-term campaign reporting in Australia leans on these figures. A 2023 parliamentary submission on Tourism Australia's work cites media mentions, advertising value, film views and website visits as short-term measures, reporting 168 million film views and nearly 1.4 billion advertising views. Those are national-scale numbers, and a small business should not benchmark itself against them. What is worth copying is the structure: separate the immediate outputs from the longer-term results.
Coverage quality over coverage count
Ten pickups on low-traffic aggregator pages are not worth one mention in the outlet your customers read. Score each piece of coverage on a few simple questions:
- Is the outlet read by your target audience?
- Does it include your key message accurately?
- Does it link to your site?
- Is it a full article, a summary or just a listing?
A simple 0 to 2 score on each gives you a quality-weighted count that is much harder to inflate.
Tracing visits and leads back to one release
This is where most small teams lose the thread. A release goes out, traffic rises for three days, and nobody can say whether the two events are connected. The fix takes ten minutes before publishing.
Step 1: Tag every link
Use UTM parameters on each link to your site inside the release. Reconnect PR's Australian guide recommends UTM parameters and Google Analytics for PR-driven sessions, then tracking form fills, downloads and purchases. A consistent naming pattern keeps reports clean:
- Source: where the link lives (for example, the distribution platform)
- Medium: a fixed label such as pressrelease
- Campaign: a short name for the story, such as spring-product-launch
Keep a spreadsheet of the tagged URLs. Inconsistent capitalisation ("PressRelease" and "pressrelease") splits your data into separate rows.
Step 2: Point links at a page built to convert
Sending readers to your homepage makes conversion hard to read. Link instead to a specific page: the product, the event registration, the donation form. If you cannot give a release its own landing page, at least link to the page where the relevant action happens.
Step 3: Set up conversions
In Google Analytics, mark the actions that matter as key events: a submitted form, a download, a completed purchase. Reconnect PR's worked example shows the arithmetic: 45 form submissions from 1,500 sessions gives a 3% conversion rate. That is your yardstick for judging whether the audience the release attracted was the right one. A release that brings 5,000 visits and no enquiries is a visibility result, not a lead result.
Step 4: Watch for newer traffic sources
A growing share of referrals now comes from AI assistants and answer engines that cite or summarise published content. If your release is likely to be quoted there, it helps to track AI referral traffic in GA4 alongside your tagged links, so those visits do not vanish into an "unassigned" bucket.
Step 5: Add the human question
Analytics miss the buyer who read the story, then phoned a week later. Add a line to your enquiry form or sales call script: "How did you hear about us?" Log "saw news release" as an answer. It is crude, and it catches what tagging cannot.
Why you should skip advertising value
Some reports convert coverage into a dollar figure by asking what the same space would have cost as an advertisement. It produces impressive numbers, which is why it persists. It is also the measure the profession has formally rejected.
AMEC's 2025 Barcelona Principles 4.0 presentation states that advertising value equivalents are invalid and should not be used as the value of communication. The 2.0 edition said the same, recommending that practitioners measure outcomes rather than only outputs and reject advertising-value equivalents.
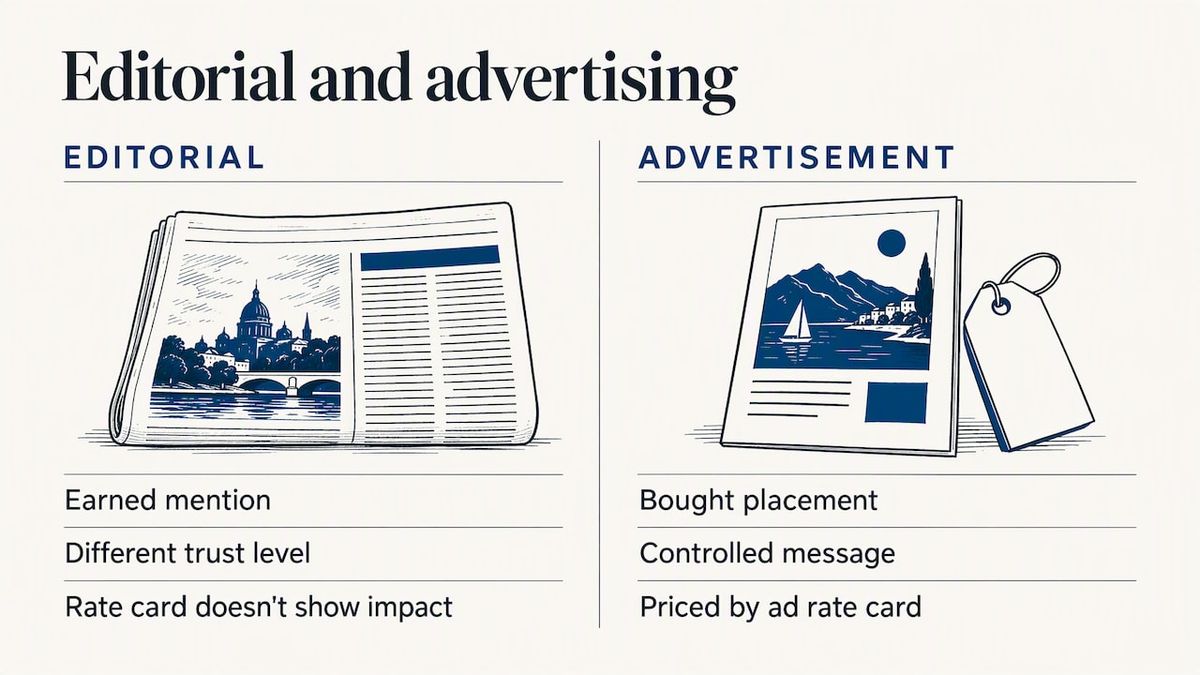
The reasoning is straightforward. An editorial mention and an advertisement are different things: one is earned and read with a different level of trust, and the other is bought and controlled. Putting a price on the first by borrowing the rate card of the second tells you nothing about what it did for your business.
Calculating ROI without fooling yourself
A simple return calculation is possible when a release has a clear, trackable result:
(Value of attributed results minus total cost) divided by total cost
Suppose a release cost $39 to distribute, plus two hours of staff time to write. If tagged sessions led to three enquiries and your average enquiry is worth a known amount to you, you can work out a return. Include your time in cost, or the number flatters you.
Three honest limits apply:
- Attribution is partial. Some readers will come back later by searching your name. Direct and organic visits after a release are real effects you cannot fully trace. Report tagged results as a minimum.
- Releases work over time. A well-optimised release can keep attracting search visits months later, so check at 30 and 90 days, not only in week one.
- Not every goal has a dollar value. Reputation, awareness and stakeholder trust are legitimate objectives. Measure them with surveys, message pickup and sentiment, and do not force a revenue figure onto them.
Using an Australian framework for planning
If you report to a board, funder or client, a recognised framework gives your numbers credibility. The Public Relations Institute of Australia's model maps inputs, activities, outputs, short-, medium- and long-term outcomes, and impact. It also includes formative, process and summative research, which means evaluating against objectives progressively through a campaign and at its end, with baseline data planned from the start.
For a single release you can compress that into a one-page plan:
| Stage | Example for a product launch release |
|---|---|
| Input | Writing time, distribution fee |
| Activity | Release published and distributed |
| Output | Pickups, impressions, referral sessions |
| Short-term outcome | Demo requests, newsletter sign-ups |
| Medium-term outcome | Sales pipeline from those requests |
| Impact | Market share or awareness lift in the target segment |
The same framework points to an implementation matrix, guidelines, an AMEC online tool and media content-analysis templates for organisations that want to go further.
How to report results
A good release report fits on one page. Marketing Mag's Australian piece advises setting KPIs and expectations early, identifying target audiences and the platforms that influence them, and integrating PR with wider communications. It suggests reporting coverage quality, business impact, sentiment, share of voice, conversations and learnings against your goals. The article's broader point is that PR results belong alongside paid, organic and earned activity, tied to business goals, and not presented as a standalone count of publicity.
A structure that works:
- Goal and result: one sentence each, side by side.
- Headline numbers: your three or four chosen KPIs, with last period or baseline for comparison.
- Best coverage: two or three examples, with the reason they matter.
- What we learned: headline that worked, outlet that underdelivered, audience that surprised you.
- Next step: what you will change in the next release.
Agencies managing several clients should keep the same template for all of them. Comparison across months is where the insight comes from.
Common mistakes that corrupt the data
- Publishing first, planning later. Untagged links cannot be tagged retroactively.
- Comparing releases of different kinds. A funding announcement and a staff appointment attract different audiences. Compare like with like.
- Counting every pickup equally. Weight by relevance and quality.
- Ignoring the headline. If views are low but engagement among those who clicked is high, the story is good and the headline or timing is the problem.
- Reporting too early. Day-three numbers rarely match day-thirty numbers.
For more on what to track beyond the release itself, see our guide to earned media metrics, and for finding coverage you did not know about, our practical guide to monitoring brand mentions. If you are still deciding where your release should travel, press release syndication in Australia explains how pickup happens.
Publish with measurement built in
News Today lets you submit a release for instant publication, with an editorial review of 24 to 48 hours where one applies, and distribution to journalists and media outlets in Australia and beyond. Releases are written for search visibility, which suits the 30 and 90 day checks described above. Premium users can analyse engagement metrics to refine their approach.
A single release is $39, one-off, and custom packages are available for enterprise clients. See the pricing page or submit your press release when your goal and your tagged links are ready.
FAQ
What is the most important press release metric?
There is no single one, because it depends on your goal. For a sales goal it is usually tagged conversions, such as enquiries or purchases. For an awareness goal it is quality coverage in outlets your audience reads, plus how well your key message came through.
How long should I wait before measuring results?
Check at a week for pickups and early traffic, then again at 30 and 90 days. Releases built for search can keep delivering visits well after the news cycle moves on, so an early snapshot will understate the result.
Can I track press release results for free?
Yes, for the core numbers. Google Analytics with UTM-tagged links covers referral sessions and conversions, Google Search Console shows search visibility and links, and free search alerts catch many mentions. Paid monitoring tools mainly add scale and broader coverage detection.
Are impressions a reliable measure?
Only as a rough estimate of potential audience. Impressions say a story could have been seen, not that it was read or acted upon. Use them to compare your own releases over time, and pair them with clicks and conversions.
Should I report advertising value to my boss or client?
It is better not to. The global measurement body AMEC has rejected advertising value equivalents as a measure of communication value. Report outcomes against your goals instead, such as leads, sign-ups or shifts in awareness.
Sources
- PR Metrics: Essential Guide to Measuring PR Success (Onclusive)
- How do you measure PR? (Finn Partners)
- Tourism Australia's international focus (Parliament of Australia)
- Measuring PR Success and ROI with Data-Driven Metrics (Reconnect PR)
- AMEC Barcelona Principles 4.0 update
- AMEC Barcelona Principles 2.0
- Measurement & Evaluation Framework (PRIA)
- How do you measure the success of PR? (Marketing Mag)